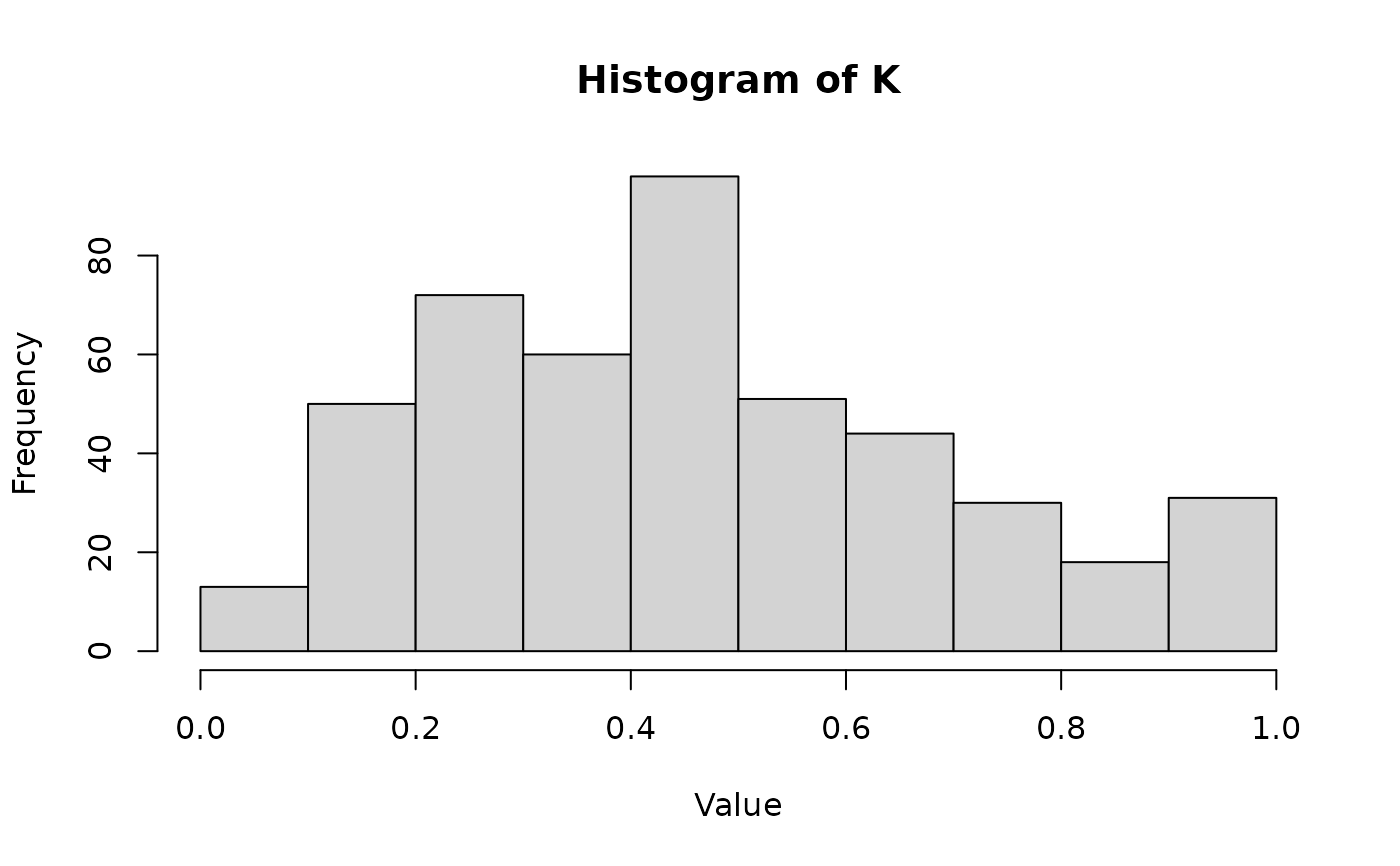
`histK()` plots the histogram of a kernel matrix.
Usage
histK(K, main = "Histogram of K", vn = FALSE, ...)
Arguments
- K
Kernel matrix (class "matrix").
- main
Plot title.
- vn
If TRUE, the value of the von Neumann entropy is shown in the plot.
(Defaults: FALSE).
- ...
further arguments and graphical parameters passed to `plot.histogram`.
Value
An object of class "histogram".
Details
Information about the von Neumann entropy can be found at '?vonNeumann()'.
Examples
data <- matrix(rnorm(150),ncol=50,nrow=30)
K <- RBF(data,g=0.01)
histK(K)
